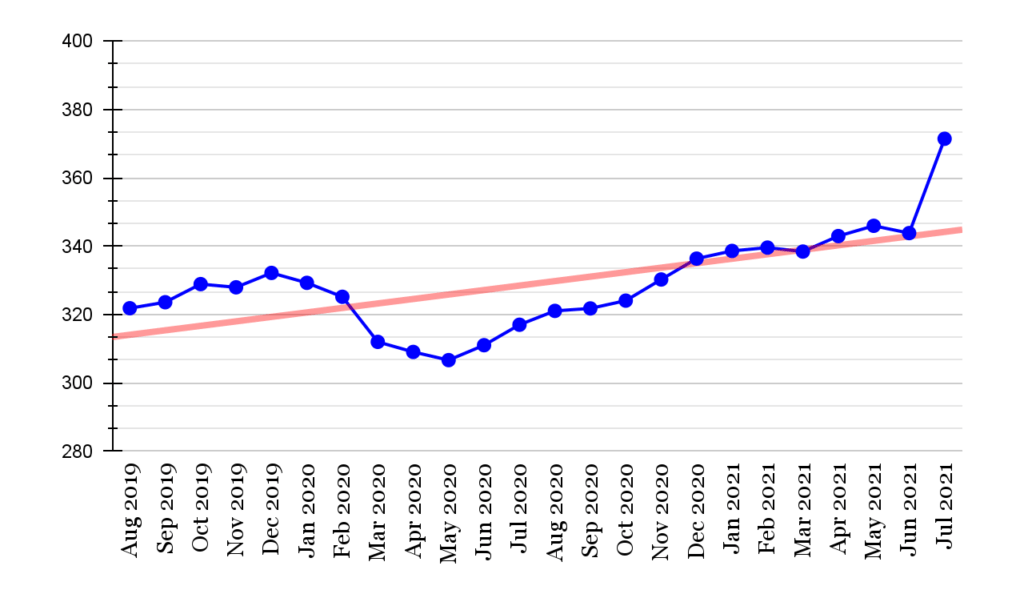
Household debt in Singapore jumped to S$371.39 billion in July 2021.
That’s a sharp increase of nearly 8% from the previous month (S$343.82 billion).
Not only is this an unprecedented figure, but it’s also cause for concern. It might be a telltale sign that Singapore’s spending has become highly disproportionate to our earning power.
Singapore Household Debt (S$ Billion)

| Monthly | Singapore Household Debt (S$ billion) |
|---|---|
| Jul 2021 | S$371.39 |
| Jun 2021 | S$343.82 |
| May 2021 | S$345.95 |
| Apr 2021 | S$342.95 |
| Mar 2021 | S$338.42 |
| Feb 2021 | S$339.58 |
| Jan 2021 | S$338.61 |
| Dec 2020 | S$336.36 |
| Nov 2020 | S$330.26 |
| Oct 2020 | S$324.08 |
| Sep 2020 | S$321.80 |
| Aug 2020 | S$321.08 |
| Jul 2020 | S$317.03 |
| Jun 2020 | S$311.05 |
| May 2020 | S$306.69 |
| Apr 2020 | S$309.08 |
| Mar 2020 | S$312.02 |
| Feb 2020 | S$325.20 |
| Jan 2020 | S$329.28 |
| Dec 2019 | S$332.18 |
| Nov 2019 | S$327.97 |
| Oct 2019 | S$328.91 |
| Sep 2019 | S$323.61 |
| Aug 2019 | S$321.86 |
Let’s examine the numbers in greater detail, beginning with credit card debt.
Credit Card Debt Tells You About the State of the Economy
Traditionally, credit card debt is the first sign of borrowers’ financial distress. If they miss paying their credit card bills, chances are that they might not be able to afford their home loans or other credit facilities.
An economic downturn, recession, and rising unemployment are typical scenarios that contribute to the rise of credit card debt.
Even though consumers in Singapore managed to keep credit card debt from escalating in 2020 despite the recession that arose out of the Covid-19 pandemic, this financial prudence seems to have stretched to a breaking point in 2021.
Credit Card Debt Dipped in 2020 — But Household Debt Began Rising
According to the Monetary Authority of Singapore (MAS), in 2020 the total rollover credit card balances dipped 15.8% from 2019. That’s great for 2020 — but it didn’t last.
By mid-2021, the overall household debt increased by over 10% to reach S$371.39 billion in July. This could mean a few situations:
- Consumers may be taking on additional debt to put into investments
- Consumer finances might have reached an unsustainable level due to depleting savings
- Consumers diligently paid off their credit bills but other household debts might have gone awry
- Declining income due to unemployment or reduced wages
- Consumers might have exhausted the stimulus payouts from the government in 2020 to cushion them from recession and unemployment
Are Consumers Spending Beyond Their Means?
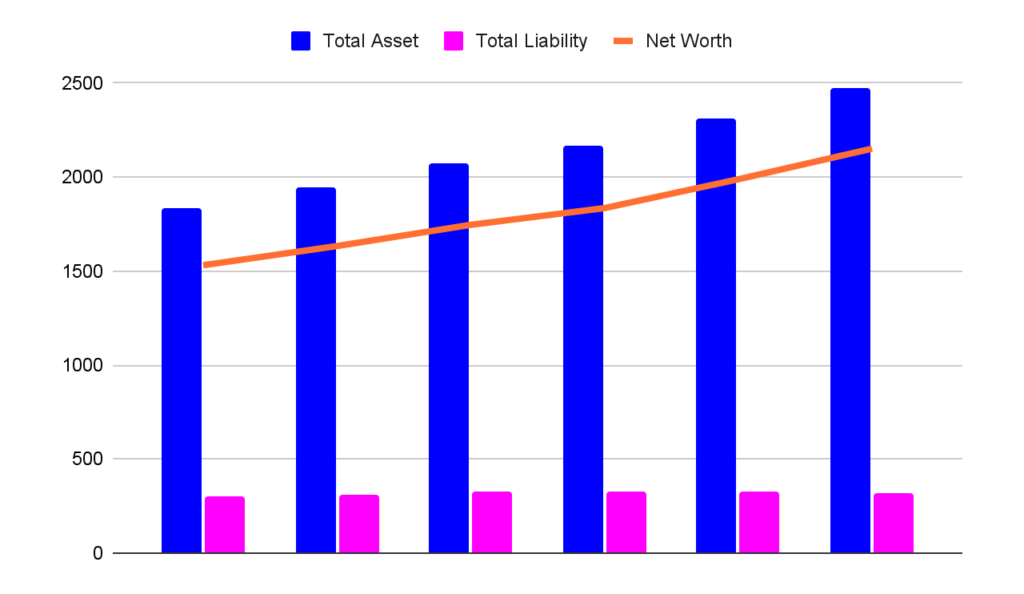
Over the period between 2015 to 2020, Singaporean households have been accumulating assets steadily. The growth can be observed in the chart below:
Household Assets and Liabilities* – 2015 to 2020

| Year | Total Asset | Total Liability | Net Worth |
| (S$ Billion) | |||
| 2015 | 1,832.8 | 301.5 | 1,531.3 |
| 2016 | 1942.5 | 309.3 | 1,633.3 |
| 2017 | 2,070.1 | 323.8 | 1,746.3 |
| 2018 | 2,163.3 | 328.1 | 1,835.2 |
| 2019 | 2,312.3 | 323.8 | 1,988.5 |
| 2020 | 2,469.8 | 318.4 | 2,151.4 |
Data source: Department of Statistics Singapore
* Assets include financial and residential properties and liabilities are made up of personal and mortgage loans.
Even with the COVID-19 pandemic in 2020, total household assets continued to trend upwards. In the same year, household liabilities also dropped significantly after a three-year spike between 2017 to 2019.
Seemingly, Singaporean households are holding back on spending amidst the pandemic to ensure they can maintain a healthy net worth. The total household net worth even reached an all-time high in 2020, with a nearly 40% increase compared to 2015!
Research has also revealed that while nearly 73% of Singaporeans own at least one credit card, credit card debt is considered low. Most consumers here are financially responsible and pay off their credit card bills on time.
Most Common Type of Credit Card Debt
Rolling over balances is one of the trickiest problems: it quickly snowballs into a bigger debt that cardholders don’t see coming. Given the convenience and perks of credit cards, cardholders might get a huge bill if they aren’t conscientious about making repayments.
Specifically, many people misunderstand how credit card interest rates are calculated. This interest rate is known as the Annual Percentage Rate (APR): it divides the annual percentage rate by 365, then multiplies the current balance by the daily rate. That amount is then added to your bill.
Many people make the mistake of only paying off the minimum sum. This completely misses the fact that what they don’t pay off accumulates daily interest. With APR, a S$5,000 debt could easily balloon to S$15,473!
Overcoming Debts with Savings
The data seems to indicate that Singaporean consumers are more financially prudent than the global average. Does this also imply that they’re much more prepared to save for retirement?
Read also: How to Get Financial Independence and Retire Early in Singapore
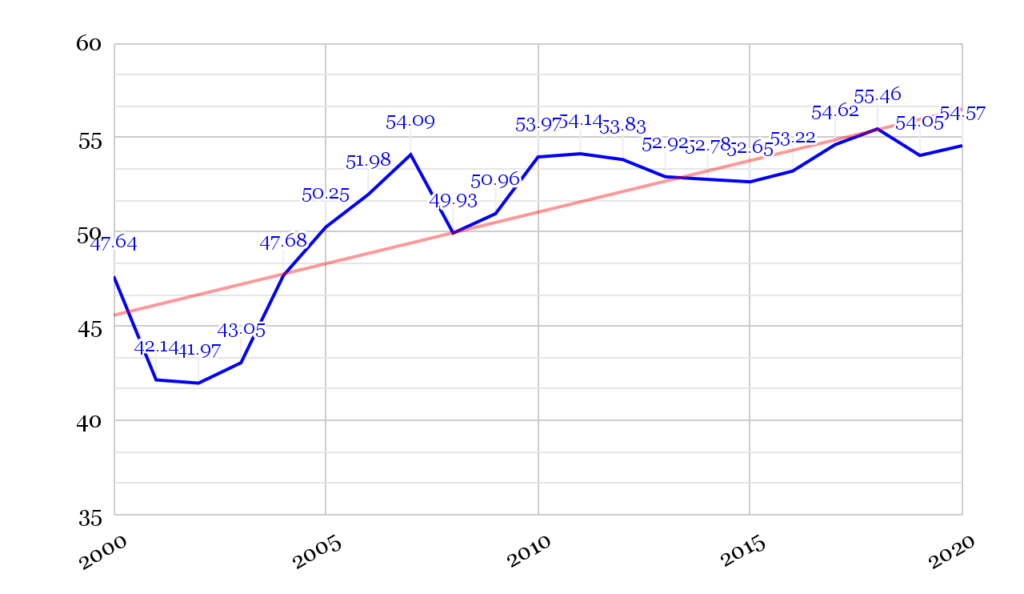
As a nation, Singapore has an estimated S$188.6 billion in Gross Domestic Savings. This is 54.57% of GDP, putting Singapore among the richest countries in the world. It’s joined by countries like Luxembourg (54.4%), Ireland (61.2%) and Brunei (50.5%); even developed nations like Canada (20.1%), Japan (26.1%), and the United States (19%) reveal less promising figures.
What does healthy Gross Domestic Savings represent? It’s an indicator of a nation’s health based on savings, which eventually leads to investments. The collective spending behaviour of households, public entities, and private corporations affect the direction of the national savings rate.
In other words: a healthy Gross Domestic Savings rate implies that Singaporeans are in a stable macro and microenvironment and able to acquire decent enough income for savings.
The Gross Domestic Savings rate for the past 20 years also reveals that national household savings have been on the rise. This is in large part due to a stable economy and sound public policies.
Singapore Gross Domestic Savings Rate (%) – 2010 to 2020

